
Someone once said, “low tides reveal the rocks.” That is what’s happening to many business processes right now. Disruption reveals where there are process problems, but data can help you diagnose those problems and make strategic decisions to work toward corrective action. In the webinar Data-Driven Tools to Bring Order from Chaos, instructor
The Data Analytics Dilemma
With the advent of big data, data science, artificial intelligence, and machine learning over the last 20 years, incredible investment has been made to make sure businesses have robust data collection and analytics. These are powerful approaches that you should be leveraging when it’s available, but when disruption occurs, all that historical data used to build the models is no longer a reflection of what current state now looks like.
During or just after disruption there isn’t an ocean of data, it’s a much smaller pond. Past data doesn’t reflect what customers and workers are experiencing and feeling. That doesn’t mean you don’t have any data; it just means you’re going to have to work with smaller samples or go out and collect new samples that reflect the current state. So where should you begin?
Getting data that’s not relevant because it’s easy to get helps no one in the end.
Scott Converse
Data Collection
Data collection doesn’t have to be hard. For good data, build a data collection and measurement plan and include all the following:
– Go to the Gemba, the place where value is created or where the work is being performed, and see in
– Make sure all your measurers have clear measurement definitions of what to measure, how to measure, where to measure, and how much to measure.
– Prototype the measurement tools before sending everyone out to collect the data. An ounce of prevention is worth more than a pound of data scrubbing.
– Make sure that the data you’re going out to get is somehow linked to the process performance or the customer need. Getting data that’s not relevant because it’s easy to get helps no one in the end.
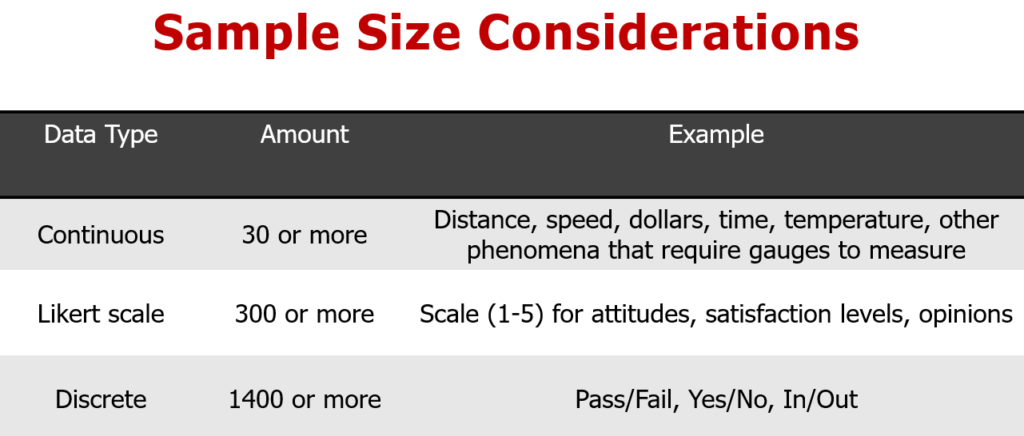
Sampling: Continuous, Likert scale, or Discrete
“How much data is enough for a sample?” is a question Scott is asked frequently in his programs, so it’s helpful to go into your data collection knowing what you’ll need to be accurate. Use these sampling rules of thumb to help with your data collection. If the measurement data you are going after is distance, speed, dollars, time, temperature, or other phenomena that you use some sort of gauge or tool to measure, 30 or more records can give you an extremely high level of confidence that what you are analyzing is a true reflection of current state.
Sampling attitudes, satisfaction levels, or emotions that are captured on a less continuous scale like the five-point Likert scale require more records to be collected. It’s good to collect 300 or more records here. Finally, when you’re measuring pass/fail or yes/no observations, you will need around 1,400 records. Sampling is a whole broad body of knowledge, and the devil is always in the details.
Completing Data Collection and Variation
Data review and analysis needs to happen next. Start by looking for patterns or trends, and then rank, sort, or order different categories, and calculate central tendency or averages. Understanding variation is frequently missed in most data review and it’s maybe the most revealing. First review the data visually, with histograms or distribution analysis, then in a descriptive way with standard deviation. Super-impose customer requirements over your visual display to help everyone understand the variation.
Variation, or spread, is often overlooked, and it can have detrimental effects on performance, even in situations where the average appears appropriate. To visually understand spread, you should histogram it. By creating a histogram, process performance data, and then superimposing your customer needs, requirements, or specifications, you’ll be well on your way toward understanding
Data collection doesn’t need to be difficult, and it can help you see problems and know how to solve them strategically. For more of an understanding of what’s normal for most businesses during data collection,
If you’re interested in continuing to learn how to use data to strategically solve business problems, we invite you to join us for Business Process Improvement Using Lean Six Sigma and Performance Metrics. Through this interactive program, you will gain a full understanding of what Lean and Six Sigma are and how to implement them in your process improvement efforts.